This article describes the anatomy of Tribby3d’s editor user interface.
Tribby3d’s user interface (UI) includes a number of components organized in a way to make easy and intuitive to use. At the center, the viewport is located with the toolbar and the panel next to it. The navbar is located above it, and the statubar is located below it.
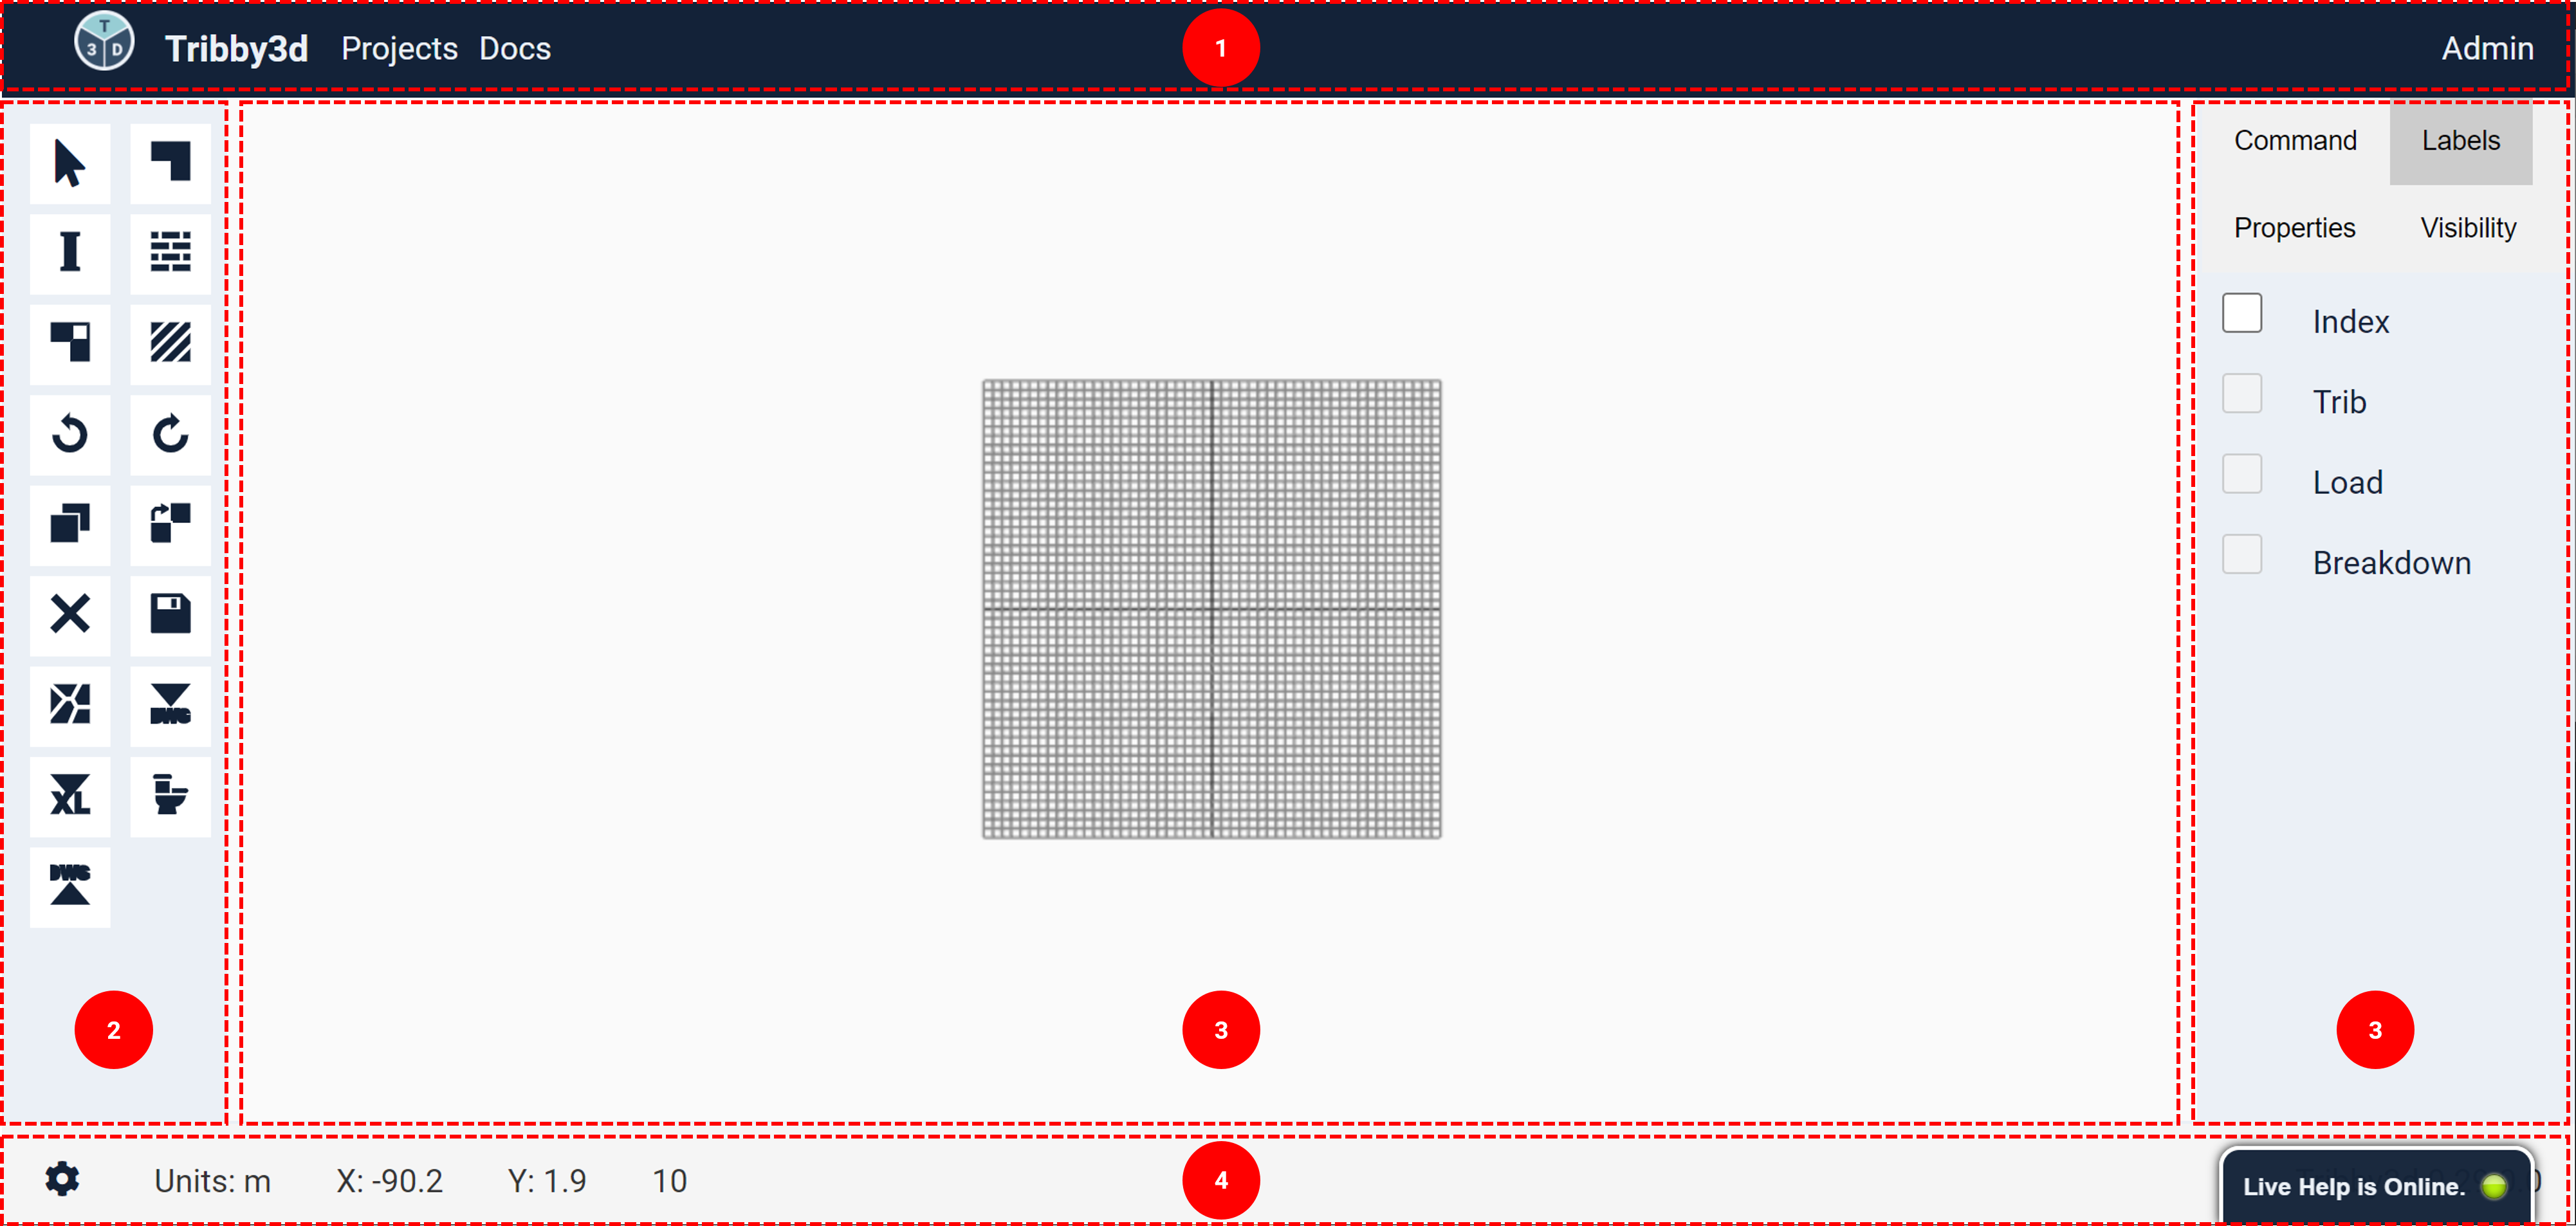
- Navbar: Located at the top, the navbar contains a number of links and buttons that are general for the entire application.
- Clicking on the icon or the “Tribby3d” text will take you to the home page.
– Clicking on “Projects” will take you back to page where the you can access all your saved projects. - The Docs link will take you to the documentation page where you can find information about the application and how to use it.
- On the far right hand side there is a link that will take you to the user page where you can find settings for your Tribby3d account.
- Clicking on the icon or the “Tribby3d” text will take you to the home page.
- Toolbar: The toolbar contains a number of tools, which are represented as buttons. Each tool triggers a command, that does something with the application. For instance, adding a column or running a tributary area calculation. To read more about the individual tools, please see the modeling section in the product documentation. Pro tip: you can increase the width of the toolbar by dragging the border between the toolbar and the viewport to the right.
- Viewport: The viewport is where the model is represented visually and is used to interact with the model. The viewport can be both 2D and 3D modes depending on which project type (ADD LINK). For single-story projects, use the following three methods to navigate the viewport:
- Zoom using the scroll wheel of your mouse.
- Right click, hold and move the mouse to Pan.
- Use the left button to select elements.
- Panel: The Panel is located to the far right of the user interface and contains a series of tabs. Each tab has it’s own functionality;
- Command – shows command specific UI components that gets activated when a tool from the toolbar is pressed. See for instance how it looks when the Draw Floor tool is activated.
- Labels – Contains checkboxes that toggles the visibility of labels in the view port. Read more about labels here.
- Properties – When an element is selected, its properties will be displayed in this tab. See an example here.
- Visibility – Contains checkboxes that toggles the visiblity of different elements types. This can be an efficient way of hiding certain parts of the model.
- Results – shows the results of the tributary area and load calculations of the model. Note: this tab will only be visible once the “Compute Tribs” tool has completed.
- Statusbar: The purpose of the status bar is to give the user a snapshot of the state of the application. For instance, the current coordinates of the cursor in the view port, or the selected unit system. The status bar also contains the button to activate the settings window to the left (the cog button). Further more, it is possible to chat with technical support using the chat window to the right hand side in case you have questions or concerns about Tribby3d. If the chat widget shows a green dot with the text “Live Help is Online”, that means someone from the Tribby3d team is available to help you directly. If not, the text will show “Offline. Leave a Message”, which allows you to send an email to us which we can reply to as soon as we are back online.